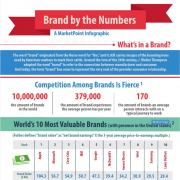
Brand by the Numbers
Some brands we love, some we hate… and most we wouldn’t miss if they went away. But every one of them – even the most obscure – has equity. Yes, brand is worth real money. In fact, the top ten brands have values that can be measured in the tens of Billions of dollars.